I can be your python data analyst, do eda, clean, analyze and visualize data
About this quest
Do You Need Expert Data Analyst for Data Visualization, BI Dashboards & Statistical Analysis!
Are you struggling to analyze raw data? Need insightful reports, interactive dashboards, or predictive analytics? I specialize in data analytics, statistical analysis, data transformation, feature engineering, and BI dashboards using Python (NumPy, pandas, Matplotlib, Seaborn, Plotly), SQL, Excel, Power BI, and Tableau. I help businesses extract insights, visualize trends, and make data-driven decisions.
Services:
- Data Cleaning, Preprocessing & Transformation Fixing inconsistencies, handling missing values.
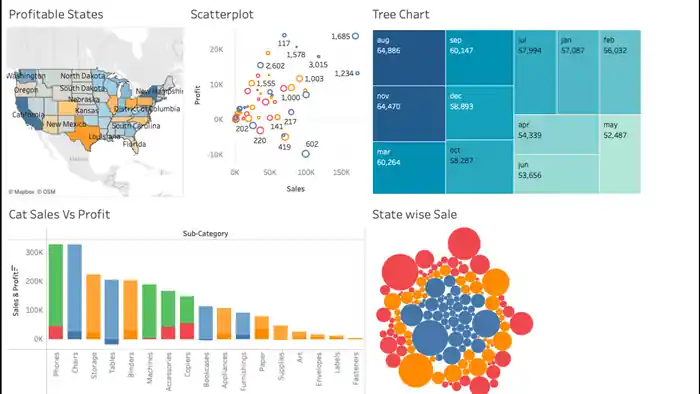
- Data Visualization & Dashboards Interactive reports using Power BI, Tableau, and Python.
- SQL Queries & Database Analysis Optimized queries for data extraction and reporting.
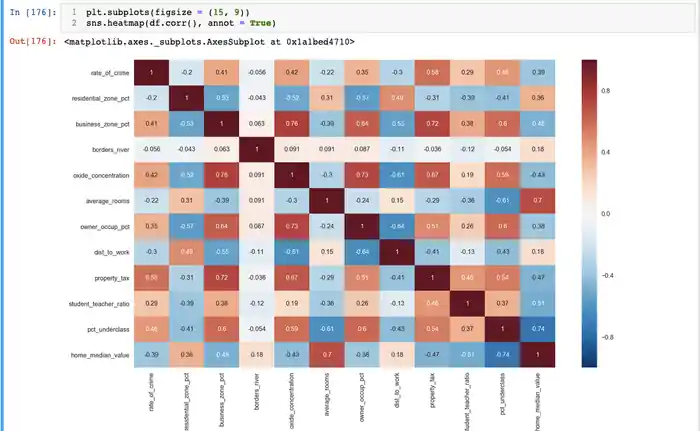
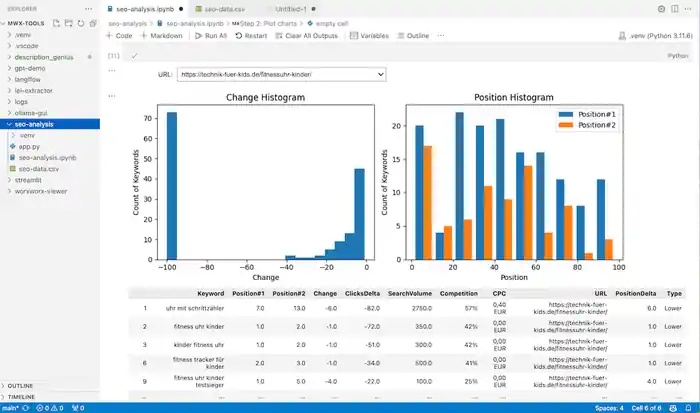
- EDA, Feature Engineering & Statistical Analysis Trends, hypothesis testing, regression, LDA & PCA.
- Excel Automation, Power Query & BI Reports Pivot tables, DAX, Power BI, and storytelling dashboards.
Why Work With Me?
- Fast & Reliable | Custom Insights & Clear Communication
Need a custom project? Message me before ordering!
Lets turn raw data into powerful insights & business success!
Compare packages
Select a package that meet your needs.
basic
$15
Starter 🚀 (Basic Data Analysis)
Basic data cleaning, handling missing values, removing duplicates, summary statistics
Problem Definition
Insights summary
Visualize results
Executive summary
1 days Delivery Time
2 revisions
standard
$30
Advanced 📊 (Full Data Analysis)
Advanced EDA, feature engineering, statistical analysis, and interactive visualizations
Problem Definition
Insights summary
Visualize results
Executive summary
2 days Delivery Time
3 revisions
premium
$60
Premium 🔥 (Analysis + Dashboard)
Complete Data Analysis with Interactive Dashboard using Power BI
Problem Definition
Insights summary
Visualize results
Executive summary
3 days Delivery Time
4 revisions
Frequently Asked Questions
What tools do you use for data analysis and visualization?
I use Python (NumPy, pandas, Matplotlib, Seaborn, Plotly), SQL, Excel, Power BI, and Tableau for data analytics, visualization, and business intelligence.
Can you clean and preprocess my messy dataset?
Yes! I handle data cleaning, preprocessing, feature engineering, and transformation to make your dataset ready for analysis.
Do you create interactive dashboards?
Absolutely! I design dynamic Power BI, Tableau, and Excel dashboards for real-time insights and decision-making.
Reviews
0 reviews for this quest
5
0
4
0
3
0
2
0
1
0
Rating Breakdown
0.0
Project Clarity & Direction
0.0
Communication & Support
0.0
Work Again Together?
0.0
0

Muhammad F.
Peshawar, Pakistan - 00:00 AM local time
Completed Mandate0
Ratio Mandate100%
Member sinceApr 2025
Reviews0.00
Total 0 reviews
Completed Mandate0
Ratio Mandate100%
Member sinceApr 2025
Reviews0.00
Total 0 reviews